In video poker mail forums, the subject of "volatility" often comes up. But, unlike variance, volatility has no agreed upon definition. In this article, I discuss a mathematical notion that is well-defined and is intuitively similar to what I think people mean by "volatility."
The graph below shows survivability curves, for 6 popular games (9/6 Jacks or Better, Pick'em, 9/5 Double Jokers, Full Pay Deuces Wild, All American, and 10/7 Double Bonus) and one less common example (Joker Wild with 5 of a Kind jackpot with the progressive at 1%). "Survivability" is the probability that you will have survived (not busted) after a certain number of hands. These curves assume that you play with a 20 unit stake (20 units = $100 for a 5 coin, $1 machine). [Note: For all results discussed here, I am assuming optimal play, but the idea works just as well for any strategy, assuming you can come up with the probability distribution.]
For each game, the probability of surviving for less than 20 hands is 100% since you can't possibly lose your stake this quickly. After that, we see a typical "S" curve: At first, the survival probability drops more and more quickly. After a bit, the rate goes down and the curve starts to flatten out. If we extended the curves far to the right, we would see each game reaching the value (100% - RoR) where RoR = Risk of Ruin. (The RoR is the chance you will lose your entire stake assuming you keep playing the same game forever.) For negative EV game such as 9/6 Jacks or Better, the RoR is 100%, so the curve will approach 0%. For Deuces Wild, the RoR for 20 units is 98.702%, so the curve will approach 1.298%. However, these asymptotic values are almost irrelevant for short term play.

The survivability curve gives us all the information we need to figure out the chance that we will bust within a certain number of hands for a given game and stake. But, we would like to have a single measure that we can use to compare games. Looking at the graph, notice where each curve crosses the "50%" line. I think the 50% line provide reasonable separation between the different games. I define half-life to be, for a given game, strategy and stake, the number of hands after which you would expect to bust 50% of the time.
From the graph above, we can see that the half-life for 9/6 Jacks with a stake of 20 (HL20) is about 200 hands (more precisely, 194.59). What does that mean? Let's say you play $1 9/6 Jacks every day in the following way: Put in $100 (20 units) and play until either you bust or have played 195 hands. Since HL20 is ~195 hands, you will expect to bust half the time and cash out something the other half. When you don't bust, you will sometimes win and sometimes lose, but overall you will still approach the overall EV of 99.54% of the game (that is, the non-busting sessions won't quite make up for the busts).
The value of the half-life number is that it can tell you what to expect in terms of how many hands you will be able to play for a given stake (not bankroll, a term which I use for your total available funds) before busting. The longer the half-life, the longer you should expect your stake to last.
I compute these values directly from the probability distributions (no simulation is involved - see below). That means that the answers are quite accurate (assuming that the input distributions are accurate) and can be computed fairly quickly. Anyway, I've chosen an 80 unit stake as the "gold standard" to compare games. This has the advantage of being an even amount for both quarter ($100) and dollar ($400) games. It is also a reasonable minimum amount to choose for a stake.In the table below I present results for a dozen games (see my strategy page for fuller descriptions) at stakes of 16, 20 and 80 bets. Note that 16 bets = $20 on a quarter machine and 20 bets = $100 on a dollar machine. These are interesting, but if you plan to play with such small stakes you aren't planning to play very long :-). The table is sorted by the half-life of an 80 bets stake (HL80).
| Game | EV | Var | HL16 | HL20 | HL80 |
|---|---|---|---|---|---|
| 9/6 Jacks or Better | 99.544% | 19.51 | 133.67 | 194.59 | 1,785 |
| Pick'em | 99.950% | 15.01 | 105.10 | 150.63 | 1,424 |
| 9/5 Dbl Jokers | 99.970% | 22.11 | 99.00 | 141.50 | 1,346 |
| Full Pay Deuces | 100.762% | 25.83 | 107.77 | 154.38 | 1,322 |
| 8/5 Bon Pok Prog @1% | 101.000% | 69.39 | 111.64 | 157.40 | 1,289 |
| All American | 100.722% | 26.80 | 83.24 | 119.42 | 1,191 |
| Hi-Lo Royal | 99.798% | 35.72 | 100.22 | 138.58 | 1,151 |
| 10/7 Double Bonus | 100.172% | 28.26 | 70.07 | 96.74 | 917 |
| 17/10 Loose Deuces | 101.600% | 70.48 | 77.60 | 106.46 | 663 |
| 9/6 DblBonus DblJackpot | 100.009% | 92.74 | 62.72 | 84.54 | 630 |
| 8/6 Dbl Dbl Your Mny | 102.600% | 71.93 | 59.09 | 78.66 | 537 |
| JW5K Prog @1% | 101.011% | 147.55 | 53.07 | 72.55 | 464 |
Most of the games above should be familiar to you (see my strategy page for more information). "8/5 Bon Pok Prog @1%" is 8/5 Bonus Poker Progressive with a jackpot of 2060 units, giving a positive expectation of 1%, and "JW5K Prog @1%" is Atlantic City Joker Wild (5 of a kind jackpot) with a 1% edge (jackpot = 1219 bets). The values for "8/6 Dbl Dbl Your Mny" are for the case where Aces are "On".
As can be seen from the table, the EV and volatility of a game has very little to do with half-life for small or moderate stakes. Volatility has much more to do with the low and middle of the pay table than with the big, rare hands.
As expected, 9/6 Jacks is the champion in terms of low volatility. I was surprised to see that Deuces actually has longer half-lives than Pick'em for stakes of 16 and 20 units -- Pick'em does overtake FPDW at the HL80 level. For those who have played it, it should not be surprising that 10/7 Double Bonus is far down the list. The games below it all have extremely high variance, which correlates with having poor payoffs in the low end and corresponding high payoffs for the rare hands. With its poor base return, it should not be surprising that Jokers Wild brings up the rear, even when the progressive value gives is a 1% edge.
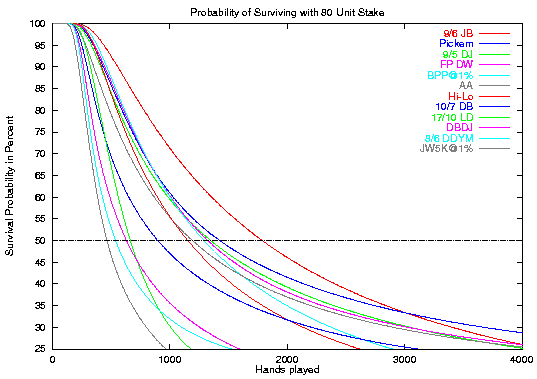
The following graph shows the survivability (surviving = 100% - chance of busting) of a 80 bet stake for the games in the table above. As can be seen, they cross the 50% line in the same order as the table. The games intertwine with each other above and below the 50% line, so the HL80 value does not give complete information about the volatility of different games. However, I think it does provide a meaningful ruler for comparison.

It's clear why the general agreement is that 9/6 Jacks has the lowest volatility of all common games -- you have a much lower chance of holding your (small) stake than with other games having higher EV. Even Pick'em, which has higher EV and lower variance that 9/6 JB doesn't have better survivability than 9/6 JB until we get to about 3000 hands. Also, high EV games such as FPDW and AA don't do better than 9/6 JB until we reach about 4000 hands.
It should also be clear why you often hear warnings about the "high volatility" of the group of games at the bottom (17/10 LD, DBDJ, 8/6 DDYM and JW5K@1%). Even though these games generally provide very nice positive EV, you are very likely to have short, unpleasant sessions while trying to get to the long run.
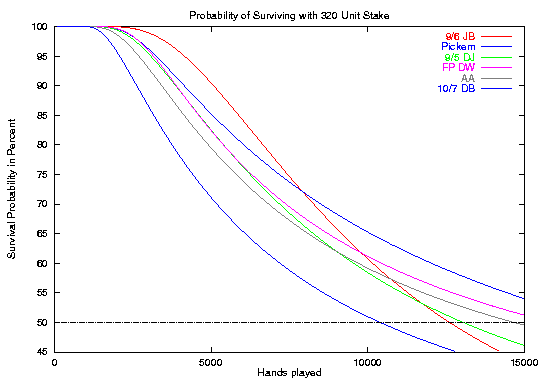
Unfortunately, the computational methods I use require a great deal more time as the starting stakes rise. I haven't run the computations for all the games listed in the table, but I did get them for six of the most popular games.

With 320 bets ($400 for quarters, $1600 for dollars), you should expect to be able to play for quite a while. Indeed, the curves show that you should be able to play 10/7 DB at least 10,000 hands half the time without busting. And some of the time when you don't bust, you will have a nice pay day from a Royal or perhaps a few Quad Aces.
In this curve, we finally see the lower of EV taking its toll on 9/6 JB. Although really bad sessions are rarer at HL320, the survivability of 9/6 JB is worse than each of the other listed games except for 10/7 DB.
To compute the survivabilty curves, I start with a probability distribution and convolute it (basically, multiply by itself over and over), chopping off the low end whenever a result dips below the stake threshold. The half-life is then computed by seeing when the bust probability exceeds 50%.
For example, let's take the case of starting with just 2 bets at Deuces Wild. At the beginning, you have a starting stake of 2 bets. After the first iteration, there is a 54.7% chance you will have only 1 bet (that's the chance of losing your bet on Deuces), a 28.5% chance you will push and still have 2 bets, a 7.3% chance you will have 3 bets, etc. On the 2nd iteration, there is a 29.9% chance you will have busted (0.549x0.549 = 0.299), a 31.1% chance you will be down by 1, etc. The 3rd iteration gives a 46.9% chance you will have busted, and the 4th iteration the bust probability goes to 56.5%. Since we want to know the 50%-bust time in hands, I linearly interpolate these last 2 for an expected 3.32 hands before busting. Thus, for FPDW, HL2 = 3.32 hands. This same method is used to generate the values in the table and the curves presented here.
When the half-life is short, the effect of hitting big hands has no effect on the half-life because there is essentially no chance of busting before at least half of the less lucky results have busted. There is a small edge effect, which I minimize by maintaining the full distribution up to 2.5 times the starting stake. For large stakes (say, over 400 bets) some small inaccuracies may be introduced, but I use some approximation techniques to minimize the effect. I'm pretty confident the result are accurate to three places.
--jazbo